Wednesday, May 31, 2006
graphing application
since i had the bitmap file stuff from the bifurcation diagram application i made yesterday and since i can't really move too well, i went and wrote my own function graphing application. i wrote this code in the past couple hours while watching the movie Dodgeball and doing leg excercises. i'm really amazed by Ben Stiller's versatility---i mean... Zoolander.
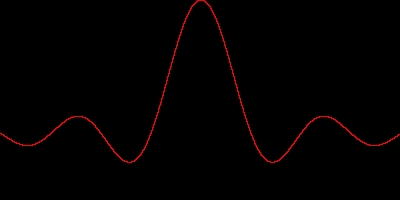
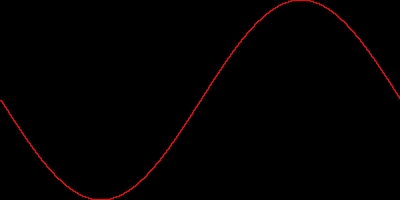
Here's sin(x) and sin(x)/x. It was only plotting points for a while, until i added the code to make the graphs continuous. maybe i'll add parametric equations tomorrow... it wouldn't be to much of stretch. I'd like to learn the AVI format next so I can make videos of math functions dancing around.
![]()